
Daily P&L is the money your positions made or lost today, measured from the previous close to the current price, plus any trading you did during the session. Track it with one consistent formula, record it every day next to the risk you took, and judge it over weeks, not hours. We built PriceWhisperer around that habit: alerts that explain themselves, risk management with position sizing, and a 50-module education program, so each day’s number has a plan behind it.
This guide covers what the number means, the formulas brokers use, a worked example, what to include or leave out, and how to read a run of days without fooling yourself.
TL;DR
-
Daily P&L (also shown as Day P/L or P/L Day) is profit or loss since the previous close, including intraday trades. It resets every day.
-
Overall or cumulative P&L adds up realized results, open positions and costs over a period. The two numbers answer different questions.
-
Brokers differ on fees, interest and currency, so write down what your own platform includes before you compare days or accounts.
-
One day tells you very little. Log each day’s P&L next to your planned risk, then review weekly and monthly for patterns, costs and drawdowns.
-
Size every position from a stop you set before entry, so a bad day stays inside a loss you chose.
Table of Contents
What daily P&L actually measures
Different platforms label it differently, but the idea is the same. thinkorswim’s glossary defines P/L Day as the money made or lost on your position from last night’s close to the current mark, plus any intraday profit and loss. Saxo Bank’s help center (updated April 1, 2026) describes Day P/L the same way: profit or loss since the instrument’s previous close, reset at the end of each day.
Two details matter immediately:
-
The baseline is yesterday’s close, not your entry price. If you bought a stock three weeks ago and it rose $1 today, your daily P&L reflects that $1, not the gain since you bought.
-
It resets. Tomorrow’s baseline is tonight’s close, so the figure on your screen at 9:31 AM ET starts again from zero.
Daily P&L vs. overall P&L
This is the question traders get wrong most often, and it is the root of many “my numbers do not match” complaints.
| Daily P&L | Overall (cumulative) P&L | |
|---|---|---|
| Baseline | Previous close | Your cost basis, or the start of a chosen period |
| Resets | Every day | Only when you pick a new period |
| Includes | Today’s price move on open positions and today’s trades | Realized trades, open positions, and usually dividends, interest and fees |
| Best for | Seeing how the day went | Seeing whether your approach is working |
Webull’s help page lists what cumulative P&L totals: realized trading P&L, open-position P&L, dividends, margin interest and fees over the selected period. A separate Webull page says cumulative P&L equals the sum of the daily P&L figures inside that period. So the two are linked: string the days together and you have the overall figure.
That same page notes that a calendar of daily P&L summed across assets can differ from account-level P&L, because account-level charges such as financing fees reduce the account figure. If your daily totals and your statement disagree by a small amount, costs are the first place to look.
How daily P&L is calculated
There is no single universal formula, because each broker decides what to include. The structure is always the same: where the position is worth now, minus where it was worth at the last close, adjusted for what you bought and sold today.
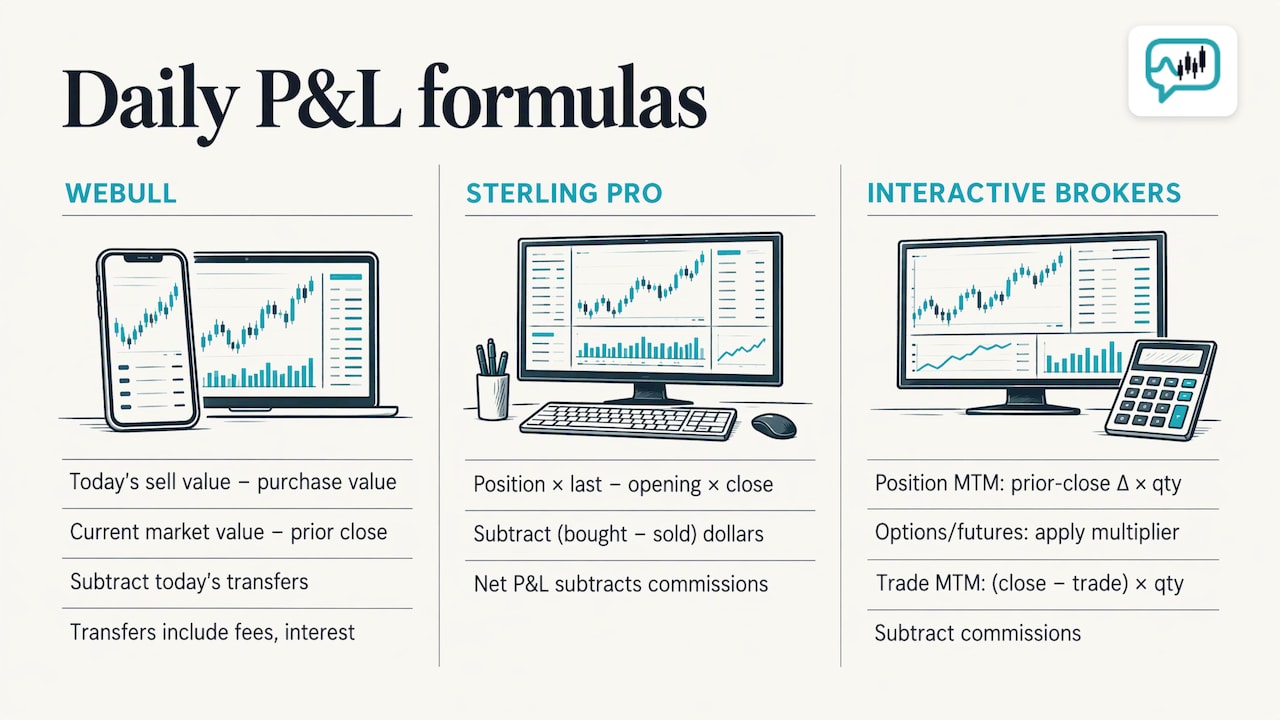
Webull gives its Day’s P&L as today’s sell value, minus today’s purchase value, plus current market value, minus previous-close market value, minus today’s transfers. Its help page says transfers include fees, interest, dividends and corporate actions.
Sterling Trader Pro’s column definitions express equity daily P/L as position times last price, minus opening position times close price, minus the difference between dollars bought and dollars sold. Its net P/L then subtracts commissions.
Interactive Brokers uses mark-to-market. Its glossary defines MTM P&L as Position MTM plus Transaction MTM minus commissions. Position MTM is the change from the prior close times the prior quantity (and multiplier for options or futures). Transaction MTM is the current close minus your trade price, times the quantity you traded.
These look different on paper but they are the same logic. The next example shows it.
A worked example
This is an illustration with made-up numbers, not a real trade.
You bought 100 shares at $50 last week. Yesterday’s close was $52. Today you sell 40 shares at $54 and the stock closes at $53.
-
Value of the position at yesterday’s close: 100 × $52 = $5,200.
-
Cash from today’s sale: 40 × $54 = $2,160.
-
Value of the remaining 60 shares at today’s close: 60 × $53 = $3,180.
-
Daily P&L: $3,180 + $2,160 − $5,200 = +$140.
The Sterling-style formula gives the same answer: $3,180 − $5,200 − (0 − $2,160) = $140.
Now the overall view. The 40 shares you sold realized $160 (40 × $4). The 60 you still hold show $180 unrealized (60 × $3). Overall P&L on the trade is +$340, before costs. Today’s $140 is only a slice of it.
What to include, and what your broker leaves out
Before you compare days, find out what your platform counts. The research shows the differences are real:
-
Commissions and fees. Interactive Brokers subtracts commissions in its MTM figure. Longbridge’s guide says its daily P/L excludes service fees. Saxo’s help page says its Day P/L excludes costs and accruals such as financing.
-
Interest, dividends and corporate actions. Webull places these in transfers, which come out of the day’s figure.
-
Currency. Saxo notes that Day P/L can be affected by intraday currency moves when a position’s currency differs from the account currency. Longbridge says P&L converted into one account currency can change from exchange rates alone, with no trading at all. Most U.S. stock traders never see this, but if you hold foreign-listed positions, it explains phantom swings.
-
Expiring options. Webull states that when a long option expires worthless, the full loss shows in Day’s P&L on the next business day, equal to cost basis plus transaction fee. A large red number the morning after expiration is not a new loss. It is the old one being booked.
-
Instrument coverage. Saxo says Day P/L is supported for all asset types except FX options and FX forwards.
The practical rule: pick one source of truth, usually your broker’s end-of-day statement, and record both the gross daily figure and the costs you paid. Then your journal and your statement reconcile.
How to track trading performance, step by step
A tracking system does not need to be complicated. It needs to be consistent. This routine works for most retail traders.
1. Record the numbers the same way every day
At the close, write down the date, the daily P&L from your broker, commissions and fees, and your account value. Use the end-of-day figure, not a screenshot from mid-session, so days are comparable.
2. Log the risk beside the result
A +$300 day means one thing if you risked $100 and another if you risked $1,500. For each trade, record the entry, the stop, the share or contract count and the dollar amount you stood to lose. Many traders express results as multiples of that planned risk: a trade that makes twice what you risked is +2R, a stopped-out trade is −1R. This keeps a big account and a small account on the same scale.
This is where our platform earns its place. PriceWhisperer’s built-in risk management provides position sizing and stop-loss suggestions, so the risk number you log is one you set before entering, not one you reconstruct afterward. If you want the arithmetic behind it, our guide to position sizing walks through how to calculate how much to buy.
3. Note why you took the trade
Write one line: the setup, the trigger, and whether you followed your plan. Alerts that come with their reasoning make this easier, because the reason for the trade is already stated. Our smart trading alerts are graded per ticker and come with the reasoning behind them, so your note can reference the signal you acted on.
4. See positions and P&L in one place
PriceWhisperer integrates with Interactive Brokers accounts to show your positions and P&L alongside the live market view. We do not execute trades, so the platform stays a place to read the market and your results, not to place orders. The live trading dashboard is where that view lives.
5. Review on a schedule
Daily: confirm the number and tag any trade where you broke your rules. Weekly: total the week and count rule breaks. Monthly: look at the bigger patterns described below. Reviews that happen on a calendar get done. Reviews that happen when you feel like it get skipped after losing days, which are exactly the days that teach the most.
Analyzing your results beyond the daily number
Once you have a few weeks of data, ask these questions of your log.
Win rate and average win versus average loss
A trader who wins 40% of trades can be profitable if the average winner is much larger than the average loser. A trader who wins 70% can lose money if the occasional loser is huge. Look at both numbers together. Average daily P&L, the total over a period divided by the number of trading days, is a useful summary, but it hides the spread, so check the best and worst days too.
Costs
Add up commissions, fees and interest for the month and compare them with gross profit. If costs eat a large share of gains, the problem is trade frequency or size, not the market.
Drawdown
Drawdown is the fall from an account’s highest value to a later low. Track your largest one. It tells you what you actually lived through and whether your position sizes were survivable. If a normal losing streak cuts the account deeper than you can stomach, size down before the streak arrives.
Patterns by time, setup and day of week
Tag each trade with its setup and the time you entered. After enough trades you may find that pre-market gap setups work for you while afternoon trades bleed, or the reverse. For active traders who start early, the pre-market gap scanner covers the open from 4 AM ET, so you can tag which pre-market ideas actually paid.
How to read a daily P&L without fooling yourself
The daily number is noisy. A few habits keep it useful.
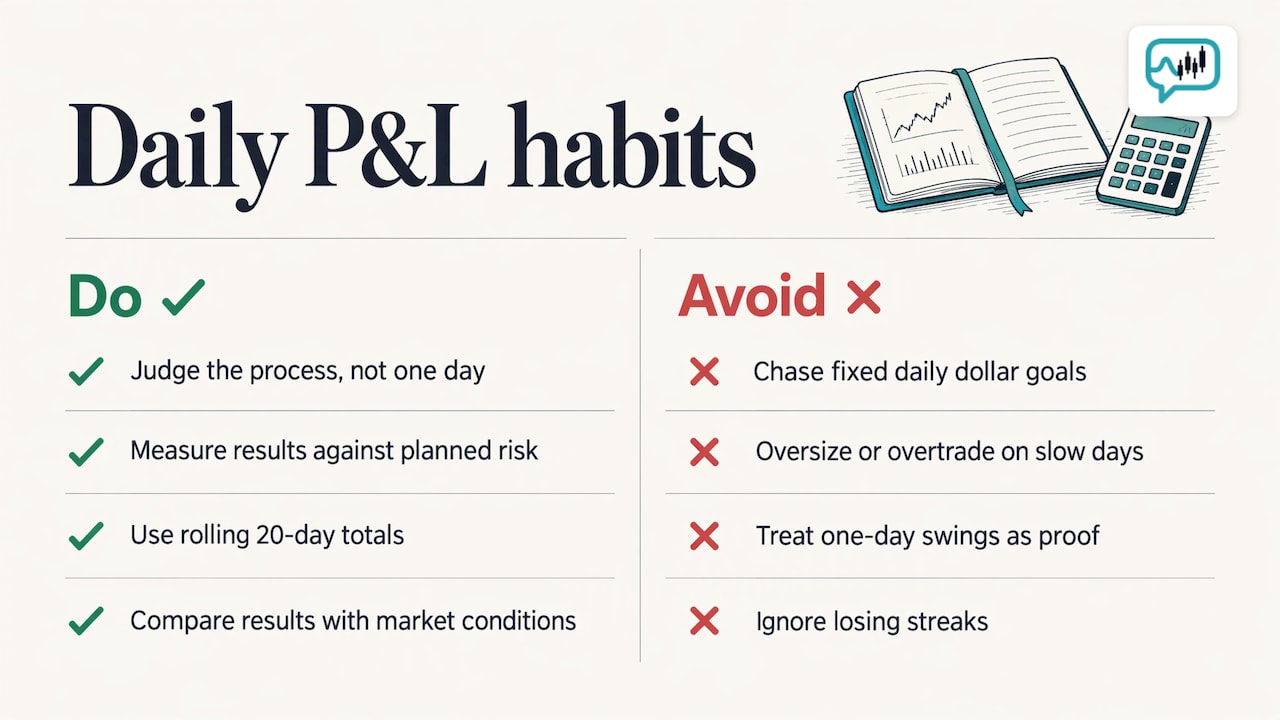
Do not judge the method by one day. A single green day can come from luck or an oversized position. A single red day can be a perfectly executed trade that was stopped out. Judge the process: did you follow the plan, and was the loss inside what you planned to risk?
Measure the day against your risk, not against a dollar goal. Chasing a fixed target such as “$100 a day” pushes traders to oversize or overtrade on slow days. A target based on planned risk and setup quality is more honest than a fixed daily amount.
Look at rolling windows. Your last 20 trading days tell you more than your last two. Because cumulative P&L is the sum of the daily figures, a rolling total smooths the noise and shows direction.
Watch the streak, not the swing. Several losing days in a row is the signal to check whether market conditions changed or whether you drifted from the plan. Reading how a stock normally behaves helps here: our alerts are based on each ticker’s own historical baseline, so you can see whether a move was unusual for that stock or ordinary for it.
Separate skill from conditions. Strong markets lift most trades. Compare your results with the conditions you traded in before deciding you have found an edge.
Learning to read these patterns is a skill, and it is the reason our trading education program exists alongside the alerts. Its modules on trading execution and trend analysis give context for the setups you are logging.
Putting it together with PriceWhisperer
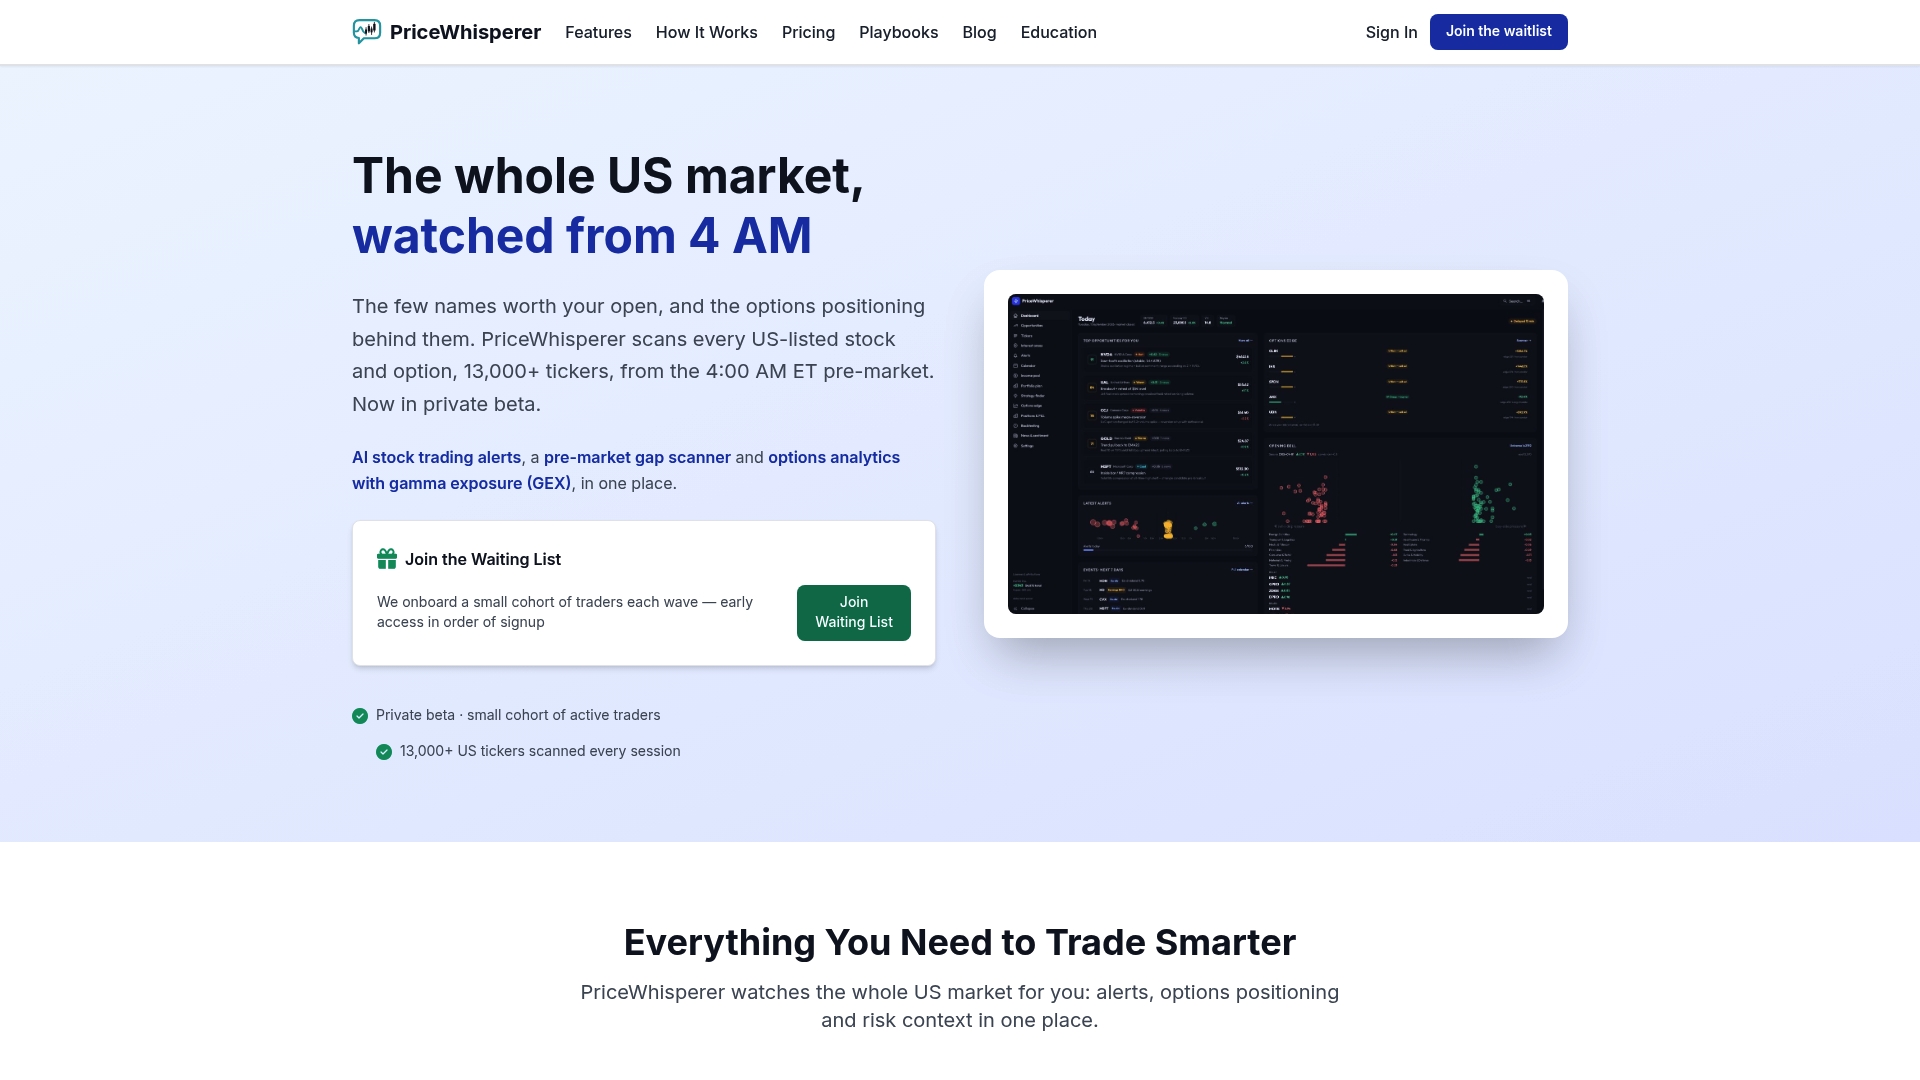
A reliable daily P&L habit has three parts: a clear plan before the open, risk sized before each trade, and an honest record after the close. PriceWhisperer scans more than 13,000 U.S.-listed stocks and options from 4 AM ET, grades alerts per ticker with the reasoning behind them, and includes risk management with position sizing and stop-loss suggestions plus a 50-module education program. The Retail Trader plan is $69 per month, Professional is $149 per month, and Desk is $249 per month per seat. There is a free trial at onboarding. See the plans and pricing to pick the one that fits.
Because there is no trade execution in the platform, nothing nudges you to act on a signal you do not understand. You decide, place the order with your broker, and your results flow back into the review routine above.
FAQ
What does P/L Day mean?
It is the profit or loss on your position since the previous close, including any trading you did today. thinkorswim’s glossary describes it as the change from last night’s close to the current mark plus intraday profit and loss. It resets each day.
What is the difference between day P&L and overall P&L?
Day P&L starts from yesterday’s close and resets daily. Overall P&L runs over a longer period and typically includes realized trades, open positions, dividends, interest and fees. Cumulative P&L equals the sum of the daily figures in the same period.
Why does my daily P&L not match my statement?
Usually it is costs or timing. Some platforms exclude fees or financing from the daily figure, others subtract them, and currency moves can change the number for accounts holding foreign positions. Check what your broker includes, then compare against the end-of-day statement.
How should I track my trading performance?
Log the daily P&L, fees, planned risk, setup and a one-line reason for every trade, then review weekly and monthly. Track average win versus average loss, costs and your largest drawdown. Judge the process over many trades, not the result of one day.
Sources
Recommended
Discussion on trading for educational purposes, not financial advice!