
A parabolic stock is one whose price rises faster and faster, so the chart bends upward like a curve instead of climbing in a straight line. The move can pay a lot in days, and it can also give most of it back in a single session. The traders who handle these stocks well do two things: they find the move early, with context, and they decide how much to risk and where to exit before they click buy. That is also how we built PriceWhisperer: it scans over 13,000 U.S.-listed stocks and options from 4 AM ET and grades each alert against that ticker’s own history.
TL;DR
-
A parabolic stock gains at an accelerating rate. The CMT Association describes a steady climb that turns steep and erratic, often ending in a wide-range bar near the high.
-
Volume usually rises with price and peaks near the top. A strong bearish candle that closes below the curve is a classic exhaustion sign.
-
Opportunity and risk arrive together. In one university study of extreme retail herding events, stocks averaged a 42% gain on the event day and were down 9% after 20 days.
-
Plan the exit first: define your risk per trade, take partial profits into strength and trail a stop on the rest.
-
Finding these moves early, with the reasoning behind each alert, matters more than chasing them once they are all over social media.
Table of Contents
What “parabolic” means in plain words
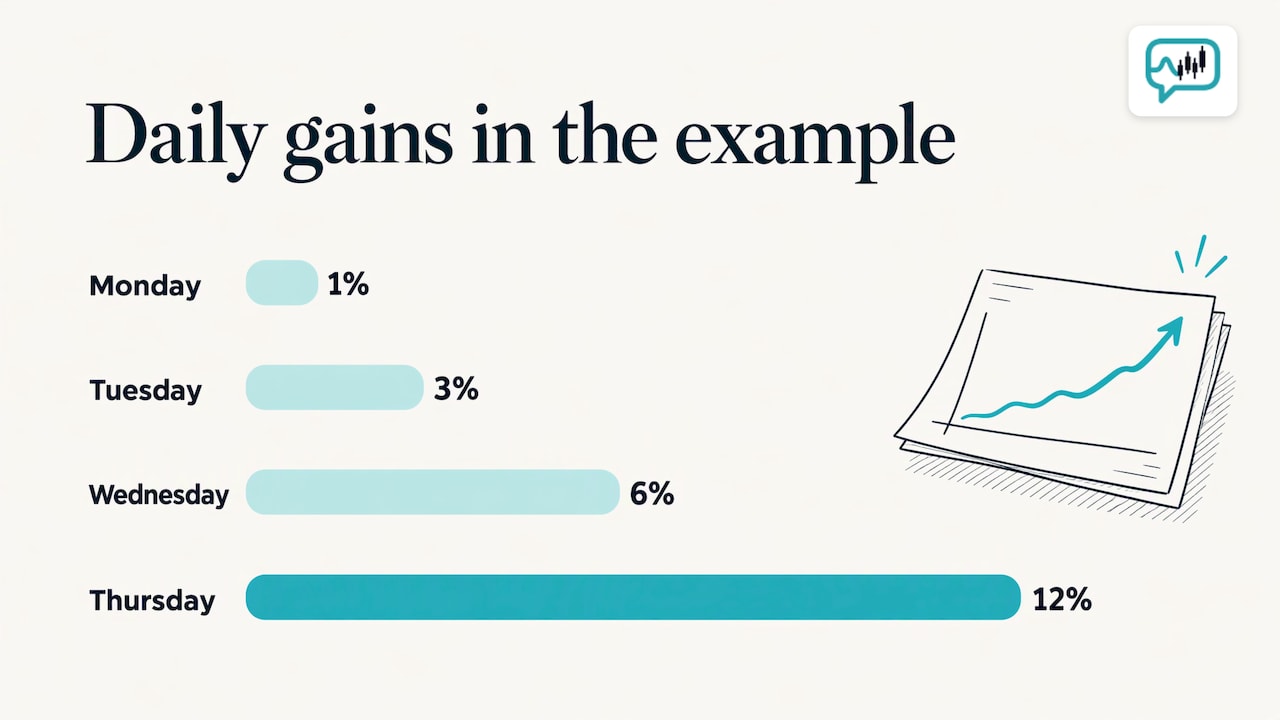
Imagine a stock that rises 1% a day for a week. That is a steady climb. Now imagine one that rises 1% on Monday, 3% on Tuesday, 6% on Wednesday and 12% on Thursday. Each day’s gain is bigger than the last. Plot that and the line curves up like the arm of a parabola, the U-shaped curve from school math. That is what traders mean by a parabolic move.
The CMT Association, the professional body for chart analysts, describes it the same way: an accelerating, curved rise in which an initially steady climb becomes steep and erratic. Early on, the stock can look like any other uptrend. The acceleration is what changes it.
Two features separate a parabolic stock from a strong trend:
-
The slope keeps steepening. Each leg up is bigger than the one before it, in percent terms and in time.
-
The move is far from normal for that stock. A volatile small cap that gains 15% in a day is behaving normally. A slow-moving large cap doing it is not. Parabolic only means something relative to the stock’s own history.
That second point is the one most chart guides skip, and it is why a flat percentage filter produces so much noise. We come back to it below.
The anatomy of a parabolic move
No two moves are identical, but the CMT Association’s description gives a useful skeleton.
Stage 1: a steady climb
The stock trends up with ordinary pullbacks. Nothing looks unusual. Many traders who later say they “caught” a parabolic stock actually bought here, on a normal breakout.
Stage 2: acceleration
Gains per day or per week get bigger. According to the CMT Association, volume typically rises as price accelerates. This is the stage where the stock starts appearing on top-gainer lists, in social feeds and in chat rooms. It is also where the risk-to-reward quietly starts to flip, because each new buyer is paying much more than the buyers before.
Stage 3: the blow-off
The curve goes nearly vertical. The same source says the move often ends in a wide-range price bar near the high, and that volume tends to peak near the top. Wide-range means the candle’s high-to-low span is far larger than recent candles: a huge up day, or a spike up that reverses within the session.
Stage 4: exhaustion and reversal
The CMT Association points to a strong bearish candle closing below the curve as a signal of exhaustion. After that, the pattern depends on the stock. Some drop sharply and keep falling. Others consolidate and rally again. What they rarely do is keep accelerating at the same angle, because a curve that steep cannot be sustained.
What makes a stock go parabolic
There is no single cause. The research points to a few repeating ingredients.
Crowd attention. A peer-reviewed 2021 study of the GameStop episode, “YOLO trading: Riding with the herd during the GameStop episode”, looked at GameStop, AMC, BlackBerry and Nokia during the short squeeze of 2020 and early 2021. It links part of next-day price variation to activity on the WallStreetBets forum relative to Google searches. The authors do not claim social media is the only driver, but they show that online attention helps explain price behavior.
Speculative corners of the market. The CMT Association names AI, crypto and small caps as settings where parabolic-looking moves may occur, and says sentiment there can be driven more by emotion and momentum than by fundamentals. Small companies with a low market cap, meaning a small total value of all shares, take less money to move. If you want a refresher on that term, the market capitalization lesson in our education program covers it.
A squeeze. When many traders have bet against a stock (sold it short) and the price rises, they must buy shares to close those bets. That buying pushes the price higher still and forces more shorts to cover. The CMT piece covers multiple-day squeezes alongside parabolic spikes for this reason.
A catalyst or a story. News, earnings, a contract, an index change or a new narrative can start the first leg. Once the curve steepens, though, price itself becomes the story.
Two real examples
GameStop, early 2021
The CMT Association cites GameStop’s 20-fold rally in January and February 2021 as a historical example of a parabolic move. In an interview dated February 5, 2021, UC Berkeley Haas professor Terrance Odean reported that the stock gained more than 400% over three days amid coordinated retail buying, then fell 44% the following day after brokerages temporarily restricted new purchases.
The lesson is about the exit. The people who held through that one-day drop gave back a huge piece of a gain that had taken days to build.
Opendoor, mid-2025
The CMT Association gives Opendoor as a newer comparison: a 19-fold rally over three months, from July to September 2025. It is a slower curve than GameStop’s, which shows the shape is not tied to one speed. A three-month parabola gives more time to act, and more time to talk yourself into holding.
Opportunity or risk? Both, and the data shows how they split
Parabolic stocks look like opportunity because the gains are real and visible. The same data also shows what often comes next. Professor Odean’s 2021 discussion of Robinhood users’ herding found that stocks with ordinary herding events, where unusually many retail accounts bought the same stock, averaged a 14% gain on the event day. Extreme herding events averaged 42%. But returns were significantly negative the next day, and the stocks were still down 5% and 9% respectively after 20 days.
Read that carefully. The gain on the day was real. It was the buyers who arrived after the event who bore the losses. The takeaway is not that parabolic stocks cannot be traded. It is that timing decides the outcome: the same stock is an opportunity at the start of acceleration and a hazard at the blow-off.
This is a general description of past events, not a forecast. Trading stocks and options involves risk of loss, including the loss of your whole position. Size every position so that a bad outcome is one you can afford.

How to spot a parabolic setup before it is obvious
By the time a stock is on every “top gainers” list, the easy part of the move is usually done. The earlier signals are subtler and need a baseline to read.
The CMT Association’s checklist for assessing a parabolic stock is a good starting point:
-
A large percentage gain over one week or one month
-
A volume spike
-
RSI above 80. RSI, the relative strength index, is a 0 to 100 momentum gauge; readings above 70 are usually called overbought, and 80 is stretched even by that standard
-
High retail interest
-
Warning signs: wide-range candles, failed breakouts and bearish divergences (price makes a new high while momentum indicators do not)
The trouble is doing this by hand. Thousands of tickers trade in the U.S., most of the interesting action begins in the pre-market, and each stock has its own normal. A 12% move is routine for one name and extraordinary for another.
That is the problem PriceWhisperer was built around. It scans more than 13,000 U.S.-listed stocks and options starting at 4 AM ET and flags significant moves based on each ticker’s own historical baseline. Because the alert is graded per ticker, a breakout in a normally quiet stock stands out from a routine swing in a volatile one. Every alert comes with the reasoning behind it, so you can see why a move was flagged. You can read how the graded smart alerts work, or see how the pre-market gap scanner surfaces unusual activity before the open. For the wider logic, our playbook on catching the breakout wherever it forms shows why scanning the whole market beats watching a short watchlist.
Options add another layer. When a stock accelerates, positioning in the options market can amplify or dampen the move. PriceWhisperer includes options positioning analytics such as gamma exposure, gamma flip levels, open-interest walls and implied versus realized volatility, and a playbook on reading options conditions across the whole market explains how to use them.
A risk plan for trading a parabolic stock
The exit rules matter more than the entry in this kind of trade. Here is a plan you can write down before the next one.
1. Decide your risk in dollars first
Pick the most you are willing to lose on the trade. Many traders use a small fraction of the account, such as 1%. Then work backward to the share count.
Illustrative example: on a $25,000 account, risking 1% means $250. If you buy at $20 and your stop is at $18, the risk per share is $2, so the position is 125 shares ($250 divided by $2). The numbers are hypothetical, but the method is the point: the stop sets the size, not the other way round.
In a parabolic stock, wide-range candles mean your stop may need to sit far from your entry. A far stop means a smaller position, not a bigger risk. PriceWhisperer’s built-in risk management includes position sizing and stop-loss suggestions, so this calculation is part of the workflow rather than something you do in a hurry on a fast tape.
2. Take profits into strength
The CMT Association recommends selling 25% to 50% of the position into strength and trailing a stop on the remainder. A trailing stop moves up as price rises and never moves down, so it locks in more of the gain as the curve steepens. The partial sale turns a paper gain into a real one, and it makes the hardest decision, selling something that is still going up, much easier.
3. Watch for the exhaustion signals
From the same guidance, watch for:
-
A wide-range candle near the high
-
A strong bearish candle that closes below the curve
-
A failed breakout, where price pushes above a prior high and falls back below it
-
A bearish divergence between price and momentum
-
Volume peaking, then fading
No single signal is proof. Two or three together near an extended price are worth acting on by tightening the stop or taking more off.
4. Respect the gap risk
A stock that closed at its high can open sharply lower the next morning, and a stop order does not guarantee your fill price in that case. The pre-market session is where this shows up first, which is one reason we scan from 4 AM ET: you see the gap before the opening bell rather than after it. The Technical Analysis module and the advanced trading strategies lesson in the education program cover how traders think about gaps and exits.
5. Do not chase the third day
If you missed the move, the next one is coming. The Berkeley data suggests that buyers who join after a stock has made its extreme one-day gain are the ones most exposed to the decline that follows. Skipping a trade costs you nothing but the opportunity. Chasing one can cost real capital.
From a one-off scramble to a repeatable routine
Most retail traders meet a parabolic stock by accident: a friend texts a ticker, or it trends on social media. A repeatable routine looks different:
-
Before the open: review the pre-market gap scanner and the graded alerts for moves that are large relative to each stock’s history.
-
At the open: check volume and whether the move holds. Note where the options positioning sits.
-
Before any entry: write down the stop, the size and the partial profit target.
-
During the move: trail the stop and look for the exhaustion signals above.
-
After: review the trade. Did you follow the plan?
The reasoning attached to each alert helps with step 5, because you can compare what the system flagged with what you actually did. Our chart pattern recognition guide and the technical analysis articles go deeper on the patterns involved.
How PriceWhisperer fits
PriceWhisperer is built for retail traders who want to find significant moves early, understand the context and manage the risk. It does not execute trades, so it never pushes you into a position. It does include a 50-module education program, and an Interactive Brokers integration to view your positions and P&L alongside the alerts.
The Retail Trader plan is $69 per month, and the Professional plan is $149 per month. The Desk plan is $249 per month per seat. New accounts start with a free trial at onboarding.

See the plans and what each includes on the pricing page, or look through the full feature list first.
FAQ
What does it mean when a stock is parabolic?
It means the price is rising at an accelerating rate, so the chart curves upward instead of climbing steadily. The CMT Association says the early climb is often steady before it turns steep and erratic. The move usually comes with surging volume and often ends with a wide-range bar near the high.
Is a stock going parabolic good?
It is good for people already holding it, and risky for people buying late. A UC Berkeley Haas discussion of extreme retail herding events reports average event-day gains of 42%, followed by negative returns the next day and a 9% decline after 20 days. The stock’s phase matters more than the label, so plan your exit before you enter.
How do you know when a parabolic move is ending?
There is no certain signal, but the CMT Association lists several warnings: a strong bearish candle closing below the curve, wide-range candles near the high, failed breakouts, bearish divergences and volume that peaks and fades. When several appear together, many traders tighten stops or sell part of the position.
What are the “parabolic 7” stocks?
There is no official list by that name, and the phrase gets used loosely online. Parabolic status belongs to a stock for a period of time, not permanently, and the names change quickly. A scanner that compares each stock’s move against its own history is a more reliable way to find current candidates than any fixed list.
Sources
-
CMT Association, Chart Advisor: Parabolic Spikes and Multiple Day Squeezes (2025)
-
YOLO trading: Riding with the herd during the GameStop episode (Finance Research Letters, 2021)
-
UC Berkeley Haas: How Robinhood’s trading app spurs investors’ herding instincts (2021)
Recommended
Discussion on trading for educational purposes, not financial advice!