
To trade momentum stocks, you find shares already moving harder than usual on unusual volume, enter on a controlled pullback or a confirmed breakout rather than in the middle of the spike, and decide your stop and position size before you click buy. The hard part is not the idea. It is being early enough to see the move and disciplined enough to size it. That is why we built PriceWhisperer to scan the U.S. market from 4 AM ET and grade each alert against that ticker’s own history.
This guide gives you the full routine: what momentum is, how to find candidates, how to catch a move without chasing it, how to enter and exit, and how to keep one bad trade from undoing ten good ones.
TL;DR
- Momentum is the rate of change in price. The strongest candidates are the stocks moving most relative to the rest of the market, and relative to their own normal behavior.
- Find them before the open: gaps, unusual volume and news catalysts, ranked against each stock’s own history rather than a flat percentage cutoff.
- Do not buy the spike. Wait for a pullback that holds or a breakout that stays above its level on volume.
- Fix the stop and the share count before entry. Risk a small, fixed slice of your account per trade.
- Momentum fails when volume dries up, when the whole market turns, and when you size up after a win.
Table of Contents
- What momentum stocks are and how momentum is measured
- Why a fixed percentage scan is not enough
- How to find momentum stocks
- How to catch momentum without chasing it
- Entry setups that fit momentum
- Exits matter more than entries
- Position size and risk
- Why momentum trades fail
- A repeatable daily routine
- Where PriceWhisperer fits
- FAQ
- Sources
What momentum stocks are and how momentum is measured
A momentum stock is one whose price has been rising (or falling) faster than most other stocks, and that tends to keep going in the same direction for a while. The idea is simple: strength attracts more buyers, and more buyers produce more strength, until something breaks the pattern.
There are two common ways to put a number on it. The American Association of Individual Investors (AAII), a nonprofit investor education group, defines momentum as the rate of change in price over a defined period. Its Momentum Grade compares a stock’s quarterly rate of change with all U.S.-listed stocks across four rolling 91-day quarters, weighting the latest quarter 40% and each of the prior three 20%.
The second is relative strength. NYU Stern professor Aswath Damodaran describes it as the ratio of a stock’s current price to its average over a longer period, such as six months or a year. You can read it on its own or rank it across many stocks.
Two takeaways matter for you as a trader:
- Momentum is relative. AAII’s analysis points out that in a market where most stocks fall, the ones falling least show the strongest momentum. A momentum screen still finds leaders in a weak tape.
- Momentum comes with urgency. Damodaran notes that momentum stories carry a sense of urgency that pulls in investors afraid of being left behind. That fear is exactly what pushes people to buy the top. Your process exists to keep you out of that trap.
Why a fixed percentage scan is not enough
Most traders start with a scan like “up 5% on volume above 1 million shares.” It works as a first pass, but it treats a sleepy utility and a volatile small-cap biotech the same way. A 5% move in a stock that usually moves 0.7% a day is a major event. A 5% move in a stock that routinely swings 6% is Tuesday.
Context fixes this. The question to ask is how large today’s move is compared with this ticker’s own history. That is the idea behind our alerts: each one is triggered by a break from that stock’s historical baseline, graded, and delivered with the reasoning behind it, so you can see why the stock was flagged instead of guessing.
How to find momentum stocks
Build a short list every morning. Four inputs do most of the work.
1. Pre-market gaps
A gap is the difference between yesterday’s close and today’s early price. Stocks that gap on real news, and keep their gains as the pre-market session builds, are the natural starting point. Gaps that fade quickly in the first hour of pre-market trading rarely turn into tradable momentum.
Our pre-market scanner reviews more than 13,000 U.S.-listed stocks and options from 4 AM ET, so by the time you sit down, the unusual movers are already ranked. You can see how it works on the unusual activity and gap scanner page.
2. Relative volume
Volume is the fuel. Compare today’s volume so far with the stock’s typical volume for the same time of day. A move on two or three times normal volume has real participation behind it. A move on thin volume is easier to reverse and harder to exit.
3. A catalyst you can name
Earnings, guidance changes, an analyst upgrade, a contract, a regulatory decision, a sector-wide event. If you cannot say in one sentence why the stock is moving, treat the move with suspicion. Catalyst-driven moves often continue for days; moves with no reason can vanish overnight.
4. Position in the bigger picture
Check the daily chart. A stock breaking out of a multi-month base into open space has room to run. A stock that spiked into a wall of old resistance has far less. For options-active names, options positioning, such as where open interest clusters and how gamma exposure is distributed, can show where price may stall or accelerate.
We also lay out a morning routine for day traders on the page about how to stop being late to the move.
How to catch momentum without chasing it
Chasing means buying after the move is already extended, with a stop so far away that a normal pullback takes you out. Catching means getting in near a defined level, where being wrong is cheap.
Three habits separate the two.
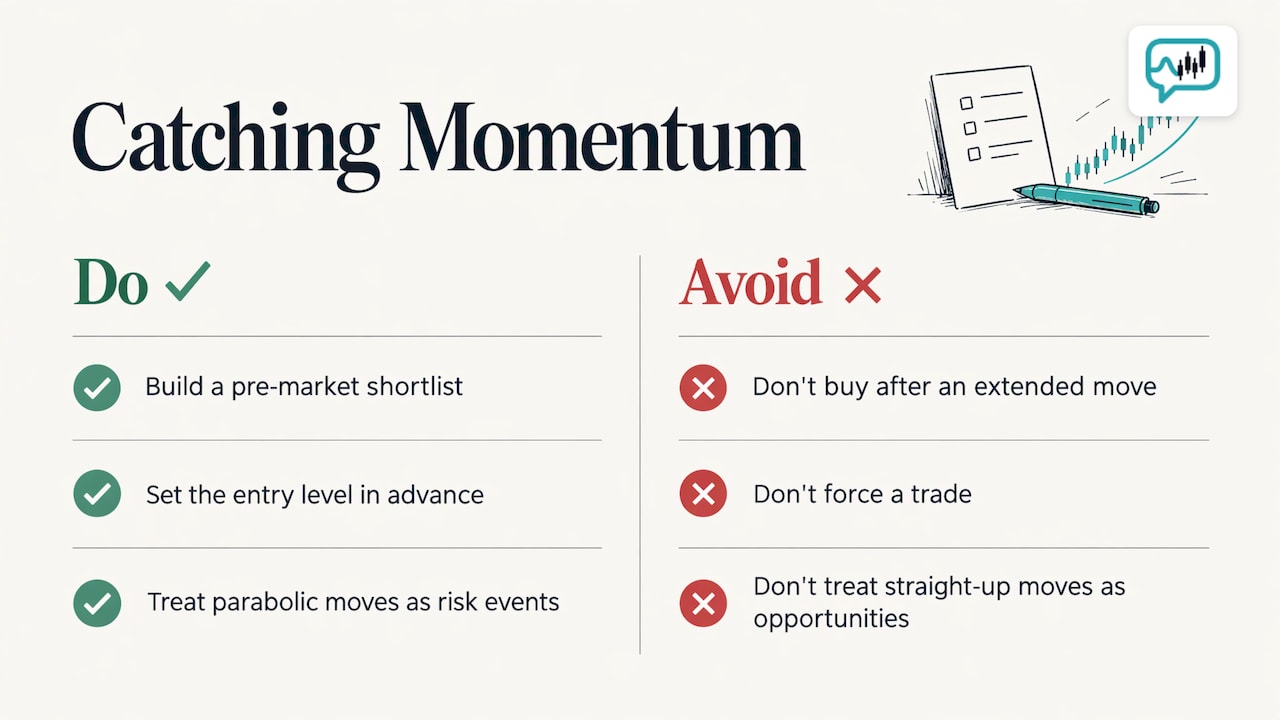
Be early, not fast. The traders who chase are usually the ones who first saw the stock after it was up 15%. A pre-market shortlist lets you watch a setup form for an hour before the open, so you act on a plan instead of an impulse.
Pick the level before the price gets there. Decide in advance: “I buy if it pulls back to the pre-market high and holds,” or “I buy if it breaks yesterday’s high on rising volume.” If neither happens, you do nothing. Missing a trade costs you nothing. A forced trade can cost a lot.
Watch for the exhaustion signs. Parabolic moves, where price rises almost vertically, end sharply. If a stock has gone straight up for several sessions with widening candles, treat that as a risk event, not an opportunity. Our guide to parabolic stocks covers how to recognize them and how to trade the risk.
Entry setups that fit momentum
There are three setups that cover most momentum trading.
The breakout
Price clears a clearly defined level, such as the high of the day, a multi-week high or the top of a consolidation range. You want volume expanding as it breaks and price holding above the level, not slipping back under it within minutes.
- Entry: just above the level, or on the first retest of it from above.
- Stop: back inside the range, under the level that defined the breakout.
- Where it goes wrong: buying a break on low volume, which is a classic false breakout.
The pullback
After a strong move, price retraces a modest amount and finds support, often near a rising short-term moving average, VWAP (the volume-weighted average price for the day) or the breakout level. The entry comes as buyers step back in.
- Entry: on the first higher low, or when price reclaims VWAP.
- Stop: below the pullback low.
- Where it goes wrong: mistaking a trend reversal for a pullback. If the dip is bigger than the prior leg up and volume rises on the way down, stand aside.
The trend continuation
For swing traders, a stock in a steady uptrend above its rising moving averages offers repeated entries on shallow dips. Trend signals such as moving-average crossovers, RSI and MACD can confirm direction, but they lag. Use them to agree with price action, never to override it.
Exits matter more than entries
Momentum trades pay when you let the winners run and cut the losers fast. That takes rules written in advance.
- Initial stop: placed at the level that proves your idea wrong, not at an amount you feel comfortable losing.
- Partial profits: many traders sell part of the position at a first target, such as a prior resistance or a gain equal to the amount risked, and trail the rest.
- Trailing stop: move the stop up under each new higher low, or under a short moving average, so a reversal takes back only a part of the gain.
- Time stop: if the stock goes sideways for hours after your entry and the catalyst is fading, the trade is not working. Leave.
A stop-loss order is an instruction to sell when price hits a set level. In fast markets the fill can land below your stop, which is called slippage, so size positions on the assumption that a stop is a target, not a guarantee.
Position size and risk
The size of the position decides whether a string of losses is a bruise or a wound. A standard approach is to risk a fixed, small percentage of your account on each trade, then work backward to the share count.
Worked example. Your account is $20,000 and you risk 1% per trade, so $200. You want to buy a stock at $50.00 with a stop at $48.00, a $2.00 risk per share. Divide $200 by $2.00: you buy 100 shares, a $5,000 position. If the stop hits, you lose about $200. If the stock reaches $54.00, you make about $400, a 2-to-1 reward for the risk.
Notice what drove the share count: the distance to the stop, not how confident you feel. A wider stop means fewer shares. This is the discipline that keeps momentum traders in the game, and our PriceWhisperer platform builds it in with automatic position sizing and stop-loss suggestions. For the fundamentals behind the math, read our risk management basics.
Two more rules help:
- Set a daily loss limit, for example 2 to 3% of the account, and stop trading when you hit it.
- Do not raise your size after a winning streak. Overconfidence after wins is one of the most common ways accounts get damaged.
Why momentum trades fail
Almost every failed momentum trade traces back to one of these causes.
- Buying the spike. Entering after a vertical run puts your stop far away and your reward close.
- Ignoring volume. A breakout without participation is likely to reverse.
- No catalyst. Moves with no reason tend to fade.
- Fighting the market. Individual stocks follow the index more than most traders want to admit. When the broader market turns down sharply, even strong stocks get sold.
- Moving the stop. Widening a stop after the trade goes against you turns a small loss into a large one.
- Revenge trading. After a loss, the urge to win it back at once leads to oversized, poorly planned trades. This piece on avoiding revenge trading describes the pattern and how to break it.
Momentum also reverses in crowded conditions. Because it rests on the idea that strength keeps attracting buyers, the same crowd that pushes a stock up can push it down together. Keep size modest and exits mechanical.
A repeatable daily routine
- Before the open: review gap and unusual-volume movers, and read the catalyst for each.
- Pick three to five names: write down the entry level, the stop and the share count for each.
- At the open: let the first minutes of trading show whether the gap holds. Act only if price reaches your level.
- During the session: manage open trades by the rules you wrote, not by how the trade feels.
- After the close: log each trade, with the reason you took it and whether you followed your plan. Review weekly.
The journal step is the one most traders skip, and it is the one that turns experience into skill.
Where PriceWhisperer fits
The routine above takes a lot of screen time. Our job is to compress the first hour of it. PriceWhisperer scans more than 13,000 U.S.-listed stocks and options from 4 AM ET and sends real-time alerts when a ticker breaks from its own historical baseline. Each alert is graded and comes with the reasoning behind it, and the risk tools suggest position size and a stop. A 50-module education program is built in, and the platform connects to Interactive Brokers so you can view positions and P&L. It does not execute trades, so every decision stays with you.
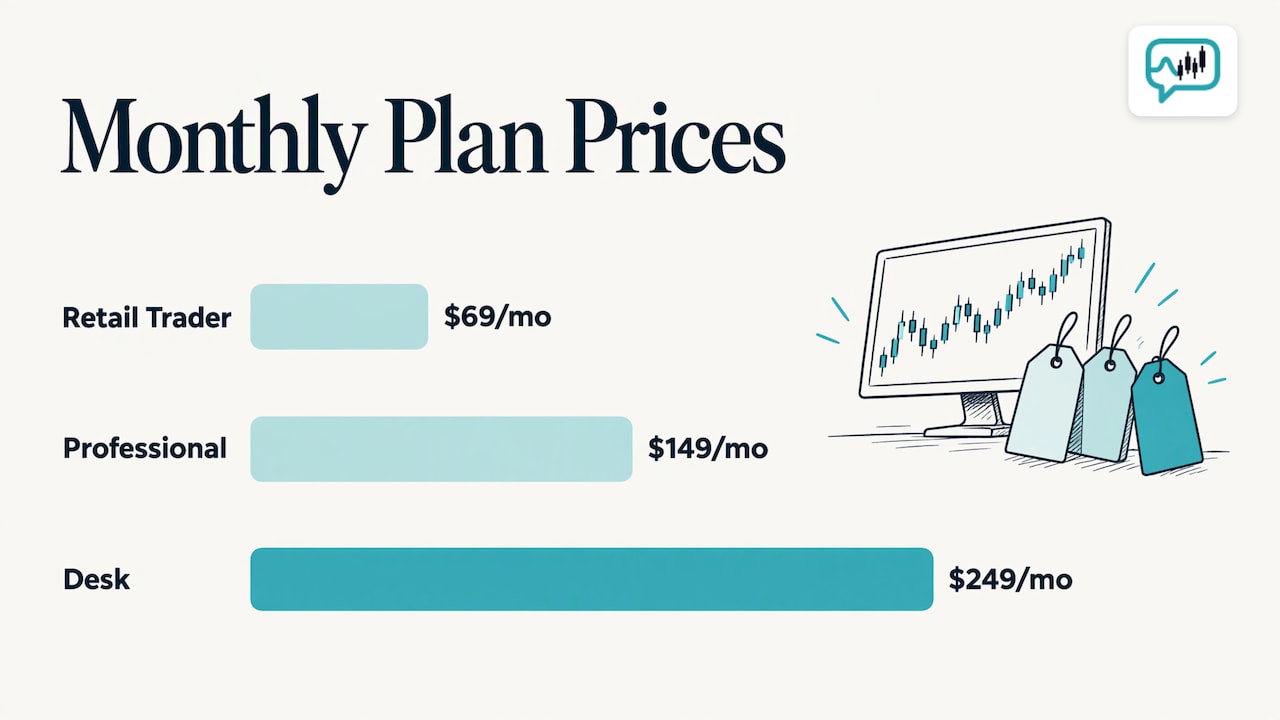
The Retail Trader plan is $69 per month. The Professional plan is $149 per month, and Desk is $249 per month per seat. An AI research add-on is $39 per month, and new accounts start with a free trial. See the plans and pricing, or look at how smart trading alerts are graded.

If you want to build the skills behind the setups, the financial trading education course covers entries, exits and execution in depth, including advanced trading strategies.
FAQ
How do I find momentum stocks?
Start before the open with a scan for gaps, unusual relative volume and a clear catalyst. Then check the daily chart for room to run. Ranking each move against that stock’s own history, rather than a flat percentage, removes many false candidates.
How do I trade momentum stocks without chasing?
Decide your entry level, stop and share count before the price gets there. Enter on a pullback that holds or a breakout that stays above its level on rising volume. If price never reaches your level, skip the trade.
How is momentum measured?
Momentum is the rate of change in price over a set period, often compared across all stocks. AAII’s grade, for example, weights the latest quarter 40% and the prior three quarters 20% each. Relative strength, the current price divided by a longer-term average, is another common measure.
How much should I risk on a momentum trade?
Many traders risk a small fixed percentage of the account per trade, such as 1%, and calculate shares from the distance to the stop. Add a daily loss limit. Trading involves risk of loss, and none of this guarantees a result, so consider speaking with a licensed financial adviser about your own situation.
Sources
- Using Momentum to Spot Outperforming Stocks, AAII
- It’s All Upside! The Momentum Story, Aswath Damodaran, NYU Stern
Recommended
- Catching the breakout wherever it forms
- Parabolic Stocks: What They Are and How to Trade the Risk
- How a day trader stops being late to the move
- Risk Management Fundamentals for Traders
Discussion on trading for educational purposes, not financial advice!