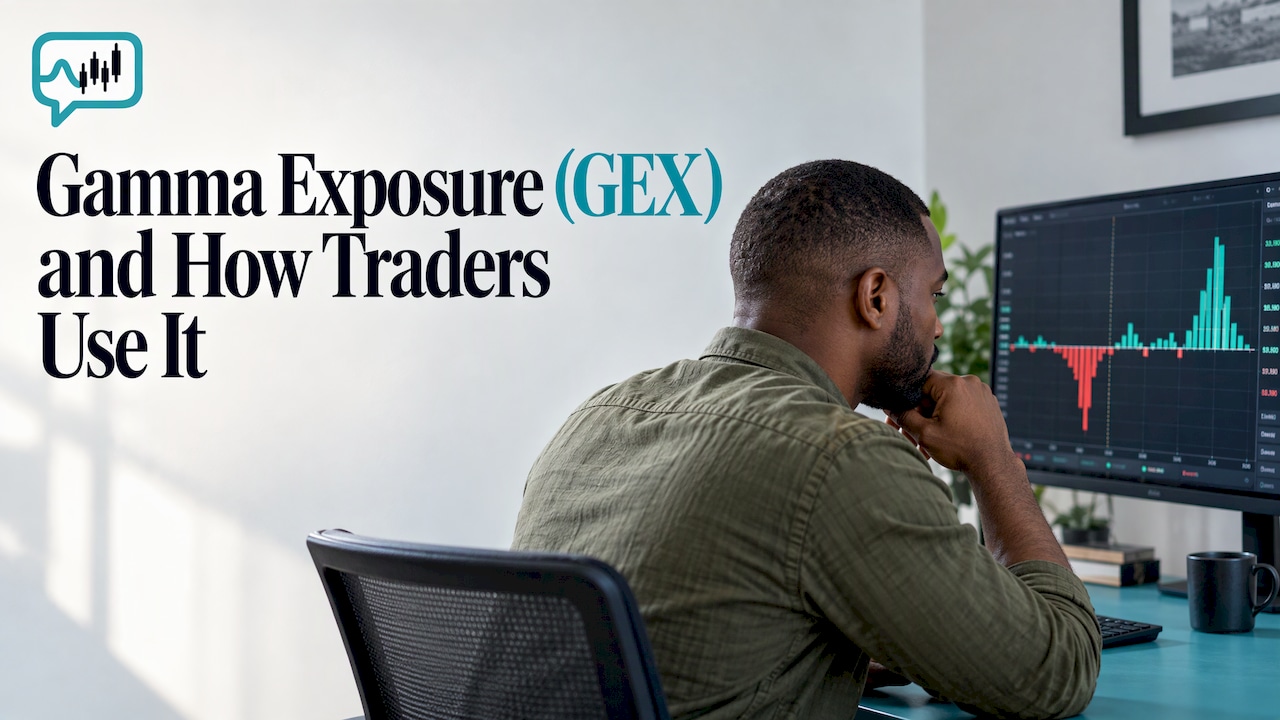
Gamma exposure (GEX) estimates how many dollars of stock options dealers must buy or sell to stay hedged when the underlying price moves 1%. Positive GEX tends to calm price swings. Negative GEX tends to amplify them. It is context, not a signal, and it works best when you pair it with alerts and a risk plan. That is how we built the options analytics in PriceWhisperer: GEX, the gamma flip and open-interest walls sit next to the price action you are already watching.
This guide covers what GEX measures, the math behind it, how to read a GEX chart, where the numbers go wrong, and how to turn the levels into a plan with defined risk.
TL;DR
-
GEX estimates the dollar value of stock that options market makers must trade to remain delta-neutral for each 1% move in the underlying.
-
Under the standard assumption, positive GEX means dealers sell rallies and buy dips (calmer tape), and negative GEX means they sell dips and buy rallies (faster, wider moves).
-
Key levels on a GEX chart are the gamma flip (where net GEX changes sign), call walls and put walls (strikes with heavy open interest).
-
Providers disagree because of position-sign assumptions, expirations, timestamps, and inputs, so treat GEX as an estimate, not a guarantee.
-
Use GEX levels as context for entries, exits and position sizing, always with a stop-loss.
Table of Contents
What is gamma exposure (GEX)?
Start with two options terms. Delta is how much an option’s price moves when the stock moves $1. Gamma is how fast delta itself changes as the stock moves. If you want the full tour of the Greeks, our options Greeks explainer covers delta, gamma, theta and vega.
Why does gamma matter to the whole market? Market makers sell and buy options to customers, then hedge by trading the underlying stock or futures so their book stays close to delta-neutral (no directional bet). Because delta changes as price moves, they have to keep re-hedging. Gamma exposure adds up that effect across every strike and expiration. One professional research paper on dealer positioning describes gamma as the estimate of how much potential delta changes as the underlying moves.
GEX, then, is a map of probable hedging flows. It does not tell you what traders think. It tells you which way dealers may be forced to trade, and roughly how much, if price moves.
If you want the market-maker side of the story, the market-making module in our education program explains why dealers quote both sides and why they hedge.
How GEX is calculated
You don’t need to compute it by hand, but knowing the recipe tells you what the number can and cannot do. A common approach, as laid out in the dealer positioning paper, sums each contract’s gamma times its open interest and the contract multiplier, then applies a sign convention to calls and puts. The dollar-per-1%-move version also scales by the spot price squared and 0.01. For each strike:
GEX = gamma × (call open interest − put open interest) × 100 × spot² × 0.01
Then you sum across strikes and expirations. The sign convention is the key assumption: calls count as positive and puts as negative, because the standard model assumes dealers are long the calls customers sold them and short the puts.
A worked example (illustrative numbers)
Say a stock trades at $500. At the 500 strike, gamma is 0.004 per share, call open interest is 10,000 contracts and put open interest is 4,000.
-
Net open interest: 10,000 − 4,000 = 6,000 contracts.
-
Gamma × net OI × 100 shares per contract: 0.004 × 6,000 × 100 = 2,400.
-
Multiply by spot squared (250,000) and 0.01: 2,400 × 250,000 × 0.01 = 6,000,000.
That strike contributes about +$6 million of GEX per 1% move. Repeat for every strike and expiration and add them up to get the total. The numbers here are made up to show the arithmetic, not a real quote.
Positive vs. negative gamma: how dealer hedging moves price
This is the part of GEX most traders came for. Under the standard assumption described in the research paper:
| Positive GEX | Negative GEX | |
|---|---|---|
| Dealer hedging after a rise | Sell | Buy |
| Dealer hedging after a fall | Buy | Sell |
| Effect on price | Dampens moves, tends to restrain volatility | Magnifies moves, tends to increase volatility |
| Typical feel | Choppy, mean-reverting, range-bound | Trending, fast, gappy |
The same paper cites the original GEX white paper from SqueezeMetrics: positive GEX corresponds to hedging that buys into lows and sells into highs, while negative GEX corresponds to selling into lows and buying into highs.
So is high gamma good or bad? Neither. High positive gamma tends to pin price and compress ranges, which suits some strategies and frustrates breakout traders. Negative gamma tends to produce larger moves, which means more opportunity and more risk at once. What matters is whether your strategy and your position size fit the regime.
A total near zero is a third case. The paper notes that a GEX reading approaching zero may let the market move without much interference from dealers’ re-hedging. Neither the dampening nor the amplifying force is strong.
How to read a GEX chart
Most GEX charts, heatmaps and tables show the same few things. Learn these, and you can read any of them.
GEX by strike
The chart plots GEX on one axis and strike price on the other. Tall bars mark strikes where hedging pressure concentrates. Bars to the right of the current price sit above the market; bars to the left sit below. Many tools split calls and puts into two colours so you can see which side dominates each strike.
The gamma flip
The gamma flip (also called the zero-gamma level) is the price where net GEX changes sign. Above it, the model says dealers are net long gamma, and hedging dampens moves. Below it, they are net short gamma, and hedging amplifies moves. Traders watch it as a regime line: a break below the flip can mean the tape gets faster. Treat it as a zone, not a precise price, because it shifts whenever open interest, volatility or spot changes.
Call walls and put walls
A call wall is a strike above the market with unusually large call open interest. A put wall is the same below the market for puts. Traders often use them as reference points where price has stalled or reversed, because heavy positioning concentrates hedging there. Walls are about open interest, so they update after each trading day as new open interest posts, and they matter most when the expiration is close.
Expiration profiles
Near-dated options carry much more gamma than long-dated ones. A chart that blends all expirations can hide that a single weekly expiration drives most of the number. Check whether a tool lets you filter to today’s expiration, this week’s or the full chain. Gamma also falls away fast after expiration, so levels that mattered on Friday may be irrelevant on Monday.
Why GEX numbers differ between providers
If you compare two GEX sources for the same ticker, you will often see different totals and different flip levels. That is normal. The dealer positioning paper lists the usual causes:
-
Position-sign assumptions (who is long and who is short)
-
Units (dollars per 1% move versus shares per $1)
-
Which expirations are included
-
Spot and volatility inputs
-
Timestamps
-
Whether the model uses open interest or flow-based estimates
So when you check any GEX reading, ask four questions: When was it computed? Which expirations does it include? What unit is it in? What sign convention does it use? A level is only comparable to another level built the same way.
What GEX can’t tell you?
GEX estimates dealer hedging based on open interest and assumed positions. The result depends on those assumptions, which expirations are included, the input data, and how dealers actually behave, as the research paper notes. Open interest is reported once a day, so intraday positioning is a guess.
Zero-days-to-expiration (0DTE) options make this more important. Cboe reported that 0DTE options made up a record 62.4% of SPX volume in August 2025, with an estimated 53% of that volume from retail traders. Because these contracts open and close within the same day, an estimate built on prior-day open interest can miss a large share of the day’s gamma.
The practical lesson: GEX describes pressure, not destiny. News, earnings, rates and big order flow can all overpower dealer hedging.
How to use GEX levels with a risk plan
GEX is most useful as a layer of context on top of price, volume and your own rules. A workable routine looks like this:
-
Check the regime before the open. Is the ticker above or below its gamma flip? That tells you whether to expect range behaviour or trend behaviour.
-
Mark the walls. Note the nearest call wall above and put wall below. They give you reference points for targets and for where a trade is proven wrong.
-
Match the setup to the regime. In positive gamma, fading extremes toward the middle of the range can fit. In negative gamma, breakouts have more room, and so do losses.
-
Size from the stop, not from conviction. Decide where the idea fails, then set position size so a stop-out costs a fixed fraction of your account. Negative-gamma days call for smaller size because moves overshoot.
-
Re-check when conditions change. A big overnight move, a new expiration or a sharp volatility jump can shift the flip and the walls.
Our risk management articles go deeper on position sizing and stops, and the trading psychology and discipline module covers sticking to a plan when the tape gets fast.
There is also a matching question for options traders: which structure fits the regime? The playbook on matching option structure to conditions walks through that logic.
Putting GEX in front of you every morning
The hard part of GEX is not the theory. It is checking the right levels across many tickers, early enough to act, without losing the morning to spreadsheets.
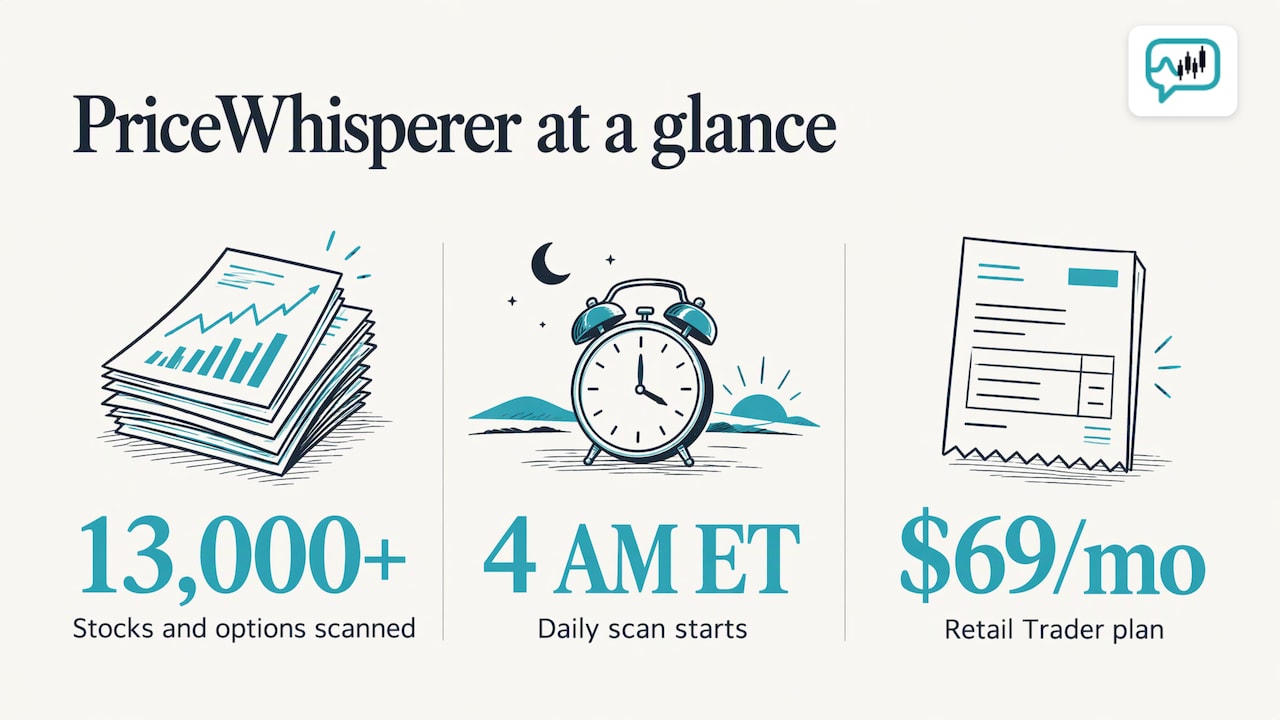
PriceWhisperer scans more than 13,000 U.S.-listed stocks and options from 4 AM ET and sends real-time alerts when a ticker breaks from its own historical baseline. Alongside those alerts, our options positioning analytics cover gamma exposure, the gamma flip, open-interest walls and implied versus realized volatility. Each alert comes with the reasoning behind it, and automatic risk management suggests position sizing and stop-loss levels. PriceWhisperer does not execute trades, so every decision stays yours.
The Retail Trader plan is $69 per month, with a free trial at onboarding. See the plans and pricing to compare it with Professional and Desk.

If you want to see how the options layer works across the whole market, read about reading options conditions across the optionable universe. To see how the alerts are graded per ticker, see our smart trading alerts.
Where GEX fits in the bigger picture
GEX is one input among several. Implied versus realized volatility tells you whether options are pricing in more movement than the stock is delivering. Pre-market gaps and unusual volume tell you where attention is going before the bell. Open-interest walls tell you where positioning clusters. Together they give a fuller picture than any one number.
If you are new to options, build from the base: learn the Greeks, then dealer hedging, then GEX. Our options trading articles and the financial trading education course follow that path, with 50 modules in total.
FAQ
What is GEX in trading?
GEX stands for gamma exposure. It estimates the dollar value of stock that options market makers must buy or sell to stay delta-neutral for each 1% move in the underlying. Traders use it to judge whether dealer hedging is likely to calm or amplify price moves.
What is the gamma flip?
The gamma flip is the price level where net gamma exposure changes from positive to negative. Above it, hedging tends to dampen moves. Below it, hedging tends to amplify them. It moves as open interest, volatility and spot price change, so treat it as a zone.
How do I check current gamma exposure for a stock or index?
Use an options analytics tool that shows GEX by strike and total GEX for the ticker. Before trusting the number, check its timestamp, the expirations included, its units and its sign convention. Our options analytics page shows GEX, gamma flip and implied volatility together.
Is high gamma good or bad?
It is neither. High positive gamma tends to restrain volatility and pin price into ranges. Negative gamma tends to magnify moves, which creates both larger opportunities and larger risks. The right question is whether your strategy and position size fit the regime.
Can GEX predict the market?
No. GEX is an estimate of likely dealer hedging, built on open interest and assumed positions. It gives context for where moves may speed up or slow down. Use it with price action and a stop-loss, and never as a standalone signal. This article is educational and is not investment advice.
Sources
Recommended
Discussion on trading for educational purposes, not financial advice!