Implied volatility (IV) is the market’s estimate of how much a stock will move, worked backward from what options currently cost. It is not a forecast of direction, and it is not a fact about the past. It is a price expressed as a percentage. Once you can read it against the stock’s own history, you can tell whether an option is cheap or expensive, why a correct call can still lose money, and which stocks deserve your attention before the open. PriceWhisperer’s options analytics put IV next to gamma exposure and open-interest levels so you read it in context, not in isolation.
TL;DR
- Implied volatility is the volatility an option-pricing model needs in order to match an option’s current market price. Higher IV means pricier options, for both calls and puts.
- Realized volatility is what the stock actually did. The gap between implied and realized is where the volatility risk premium lives.
- IV Rank and IV Percentile tell you whether today’s IV is high or low compared with roughly the past year.
- IV usually climbs into events like earnings and drops once the news is out (IV crush), which can wipe out the gain from guessing the direction right.
- Judge IV per ticker. A 40% reading is high for one stock and ordinary for another.
Table of Contents
- What implied volatility is
- How implied volatility works under the hood
- What high and low IV mean for an option’s price
- Implied vs realized volatility
- IV Rank and IV Percentile: is this IV high or low?
- IV crush: why being right can still lose money
- Putting IV to work before the open
- Try it on your own watchlist
- FAQ
- Sources
What implied volatility is
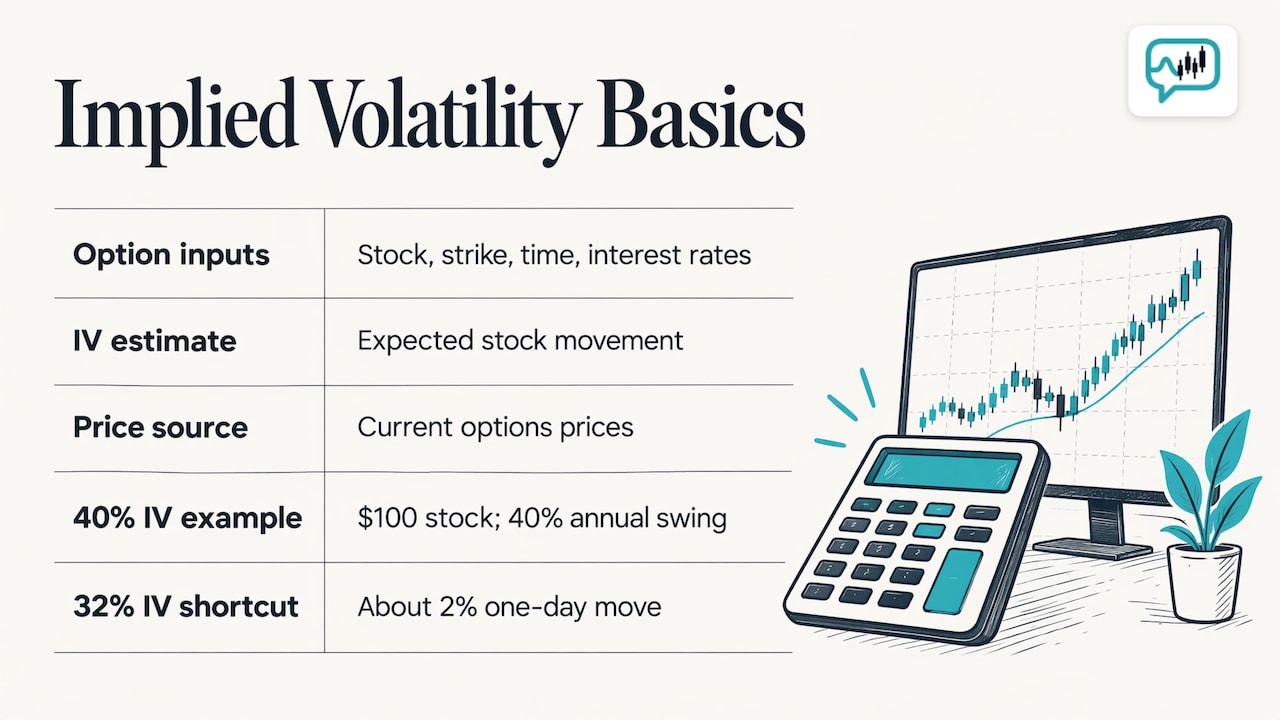
Every option price has several ingredients: the stock price, the strike, the time left, interest rates, and an estimate of how much the stock will move. The first four are observable. The last one is not, so the market reveals it through the price. The Options Industry Council (OIC) describes implied volatility as the market’s prediction of expected volatility, calculated indirectly from current options prices using an option-pricing model.
Think of it like this: if a $100 stock has options priced as though it could swing 40% over a year, the market is “implying” 40% volatility. Nobody typed that number in. It is the consensus of every buyer and seller, and an OCC/OIC webinar notes that only options have implied volatility, because it exists only where there is an option price to reverse-engineer.
IV is quoted as an annualized percentage. A rough rule of thumb many traders use: divide by about 16 to get an approximate one-day move (the square root of 252 trading days is close to 16). So 32% IV suggests roughly a 2% daily move as a one-standard-deviation estimate. Treat that as a mental shortcut, not a guarantee.
How implied volatility works under the hood
The standard Black-Scholes formula takes volatility as an input and returns a price. Implied volatility runs the formula in reverse. Because the formula rises steadily as volatility rises, only one volatility value reproduces the observed option price, according to a University of Chicago survey of the subject. In practice, software searches for that value, since there is no simple closed-form answer.
Two consequences follow:
- IV is model-dependent. It is the input that makes a model’s value equal the market price, which is why the OCC calls it subjective and distinct from historical volatility.
- IV reflects supply and demand. When traders rush to buy protection or speculate on a big move, option prices rise and IV rises with them.
The best-known example is the VIX. The Bank for International Settlements describes it as a model-free measure of implied volatility on the S&P 500, built from a wide range of calls and puts with a 30-day maturity.
What high and low IV mean for an option’s price
Holding everything else constant, an increase in IV raises both call and put prices, and a decrease lowers both. Volatility is the sensitivity that options greeks call vega. If you want the full set, our guide to options Greeks walks through delta, gamma, theta and vega.
A simple way to use this:
- High IV: options are expensive. Buyers pay more for the same exposure, and sellers collect more premium.
- Low IV: options are cheap relative to recent history. Buyers pay less, but the move still has to materialize.
The same webinar adds a warning worth remembering: it is not safe to assume an option’s IV will return to the underlying’s historical volatility. IV can stay elevated or depressed for a long time.
The smile and the skew
IV is not one number per stock. Options at different strikes and expirations trade at different IVs. The OCC explains that pricing models assume log-normal price distributions, which understate the chance of very large moves, so traders use higher volatilities for out-of-the-money options. The result is the volatility smile or skew. Across strikes and expirations, these IVs together form what academics call a volatility surface.
Practical takeaway: when you compare IV across stocks or dates, compare the same expiration and similar strikes, such as at-the-money options a month out.
Implied vs realized volatility
The two terms sound alike but answer different questions.
| Implied volatility | Realized volatility | |
|---|---|---|
| Looks | Forward | Backward |
| Comes from | Option prices | Actual price changes |
| Nature | Market expectation, plus a price for risk | Measured fact |
| Use | Judge how expensive options are | Judge how much the stock really moved |
The BIS defines realized volatility as based on observed asset returns, while implied volatility is derived from option prices and reflects expectations of future movements and the appetite for holding that risk. The difference between implied and projected realized volatility can be read as a proxy for the volatility risk premium, the compensation investors demand for bearing the risk of sharp volatility changes.
Why they diverge
Implied volatility often differs from what follows because it contains a price for uncertainty, not just a forecast. The OCC/OIC webinar also points out that a change in historical volatility may or may not move an option’s price, while a change in IV directly affects its time value. That is why an option can reprice even when the stock itself has barely moved.
A worked comparison
Suppose a stock has 30-day IV of 45%, but over the last 30 days it realized only 28%. Options are priced for much bigger swings than the stock has recently delivered. That does not mean options are a bad buy or a sure sale: an earnings date inside the window could justify the premium. It means you should ask what the market sees coming. Looking at the same ticker’s realized-versus-expected picture in another market, such as gold, shows the same principle: expectations and observed moves are different measurements.
IV Rank and IV Percentile: is this IV high or low?
A raw IV number means little without context. Two tools supply it, both described in an OIC article on volatility and options pricing:
- IV Rank places current IV on a 0 to 100 scale over the past year. Zero is the lowest point in 12 months, 100 is the peak, 50 is the middle of the range.
- IV Percentile is the share of days over that period when IV was lower than today. A reading of 72% means IV has been lower 72% of the time.
Neither predicts direction, but both add historical context. The OIC also notes that a single unusually high or low day can skew IV Rank because it looks only at the top and bottom of the range, while IV Percentile is less affected by one outlier. Many traders therefore read both together.
On how to act: the OIC says low IV may favor calls or debit call spreads, while elevated IV may favor credit strategies. It cites 14% within an 11% to 26% range as relatively inexpensive. The point is the comparison to the stock’s own range, not the number itself.
To see how a structure can be matched to these conditions, read our playbook on matching the options structure to the market.
IV crush: why being right can still lose money
Implied volatility tends to climb into a known event such as an earnings report, which pushes option prices up. After the news, uncertainty disappears and IV often drops quickly. The OIC calls this volatility crush, and because an option’s price depends on both direction and IV, a sharp drop can offset some or all of the gain from calling the direction correctly.
The OIC’s own example makes it concrete. A trader buys a $105 call for $2.90 on a $100 stock before earnings. The stock rises to $106, yet the option falls to $2.10 because IV drops from 80% to 30%, as laid out in The Crush Is Real. The stock moved the right way and the trade still lost.
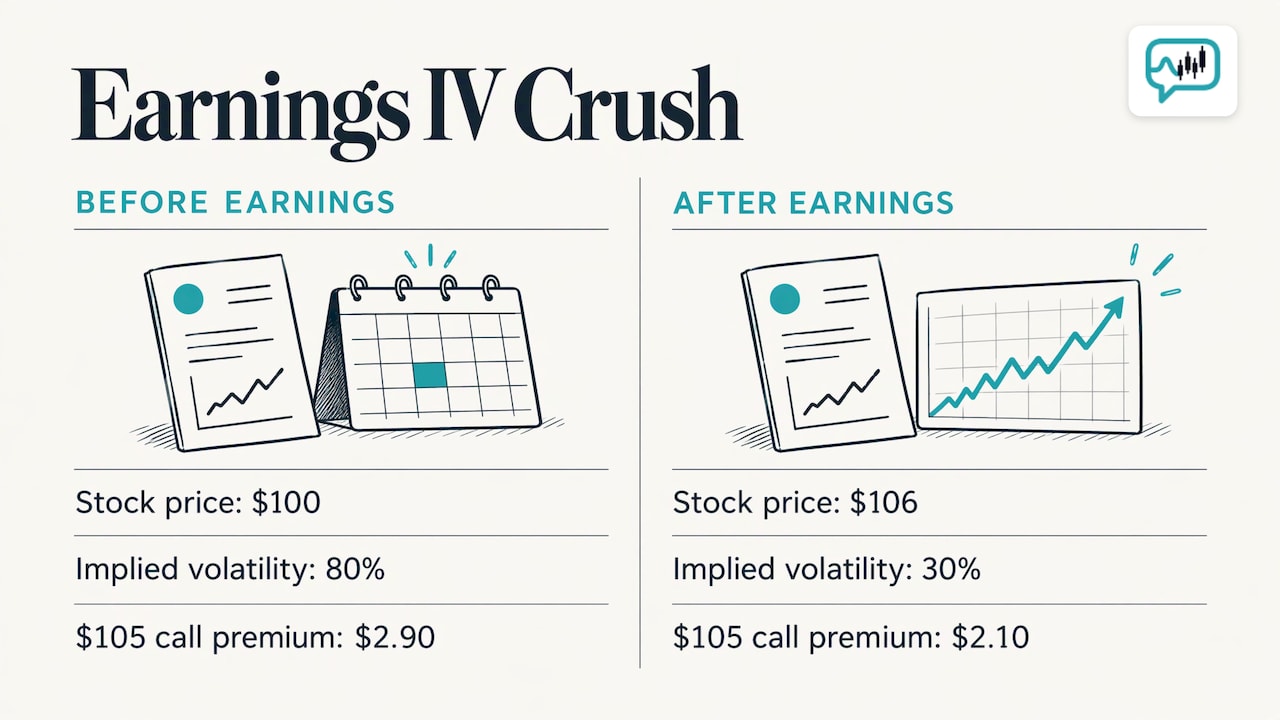
The OIC frames this as the market doing its job: options are priced for expectations, and when an event passes, uncertainty is replaced with certainty and options reprice accordingly.
How to plan around it
- Check the calendar for earnings or other scheduled events before you buy an option.
- Look at IV Rank and IV Percentile. High readings into an event suggest the premium already includes the expected move.
- Compare the implied move with what the stock has actually done around past events.
- Size the position for the case where IV falls even if the stock cooperates.
Step 4 is where risk management matters most. Position sizing and stop levels are built into PriceWhisperer’s risk management tools, so a position sized for a crush scenario is part of the workflow, not an afterthought.
Putting IV to work before the open
IV only helps if you see it before the move. Checking IV, rank and expected moves for hundreds of tickers by hand is not realistic. PriceWhisperer scans over 13,000 U.S.-listed stocks and options starting from 4 AM ET and sends alerts based on each ticker’s own historical baseline, so a move is judged against how that stock normally behaves. Its smart alerts come with the reasoning behind them, and its analytics cover implied versus realized volatility alongside gamma exposure, gamma flip and open-interest walls. For a market-wide view, see how to read options conditions across the whole market.
The platform does not execute trades. It gives you the information and the education modules so the decision stays yours.
Try it on your own watchlist
PriceWhisperer’s Retail Trader plan is $69 per month, Professional is $149 per month, and Desk is $249 per month per seat. An AI research add-on is $39 per month, and a free trial is available at onboarding. Details are on the pricing page.
If you want to keep learning first, our options trading articles cover the strategies that follow from reading IV well.
FAQ
What is a good implied volatility for buying options?
There is no universal number. The useful question is where IV sits against the stock’s own past year. The OIC suggests low IV may favor calls or debit call spreads, while elevated IV may favor credit strategies, so IV Rank and IV Percentile matter more than the raw percentage.
Does high implied volatility mean the stock will move a lot?
It means the market is pricing a larger move, not that one will happen. IV reflects expectations and the price of risk, and it can stay high while the stock stays quiet. Realized volatility tells you what actually occurred.
What is the difference between implied and historical volatility?
Historical (realized) volatility is measured from past price changes. Implied volatility is backed out of current option prices and looks forward. The gap between them is a proxy for the volatility risk premium, as described by the BIS.
What does IV crush mean?
IV crush is the quick drop in implied volatility after a known event such as earnings, when uncertainty is resolved. Option prices fall with it, which can offset gains from the stock moving in your favor.
Sources
- OIC: Technical Information FAQ
- OIC: Implied Volatility, An Overview
- University of Chicago: Implied Volatility, Statics, Dynamics and Probabilistic Interpretation
- OCC/OIC webinar, December 19, 2023
- BIS: Volatility concepts and the risk premium
- OIC: The Crush Is Real
- OIC: July Office Hours FAQs
- OIC: September Office Hours FAQs
- Gold volatility: what moves it
Recommended
- Options Greeks: Delta, Gamma, Theta, Vega
- Options Analytics: GEX, Gamma Flip and IV
- Gamma Exposure (GEX): What It Is and How Traders Use It
- Mastering the Iron Condor Options Strategy
Discussion on trading for educational purposes, not financial advice!